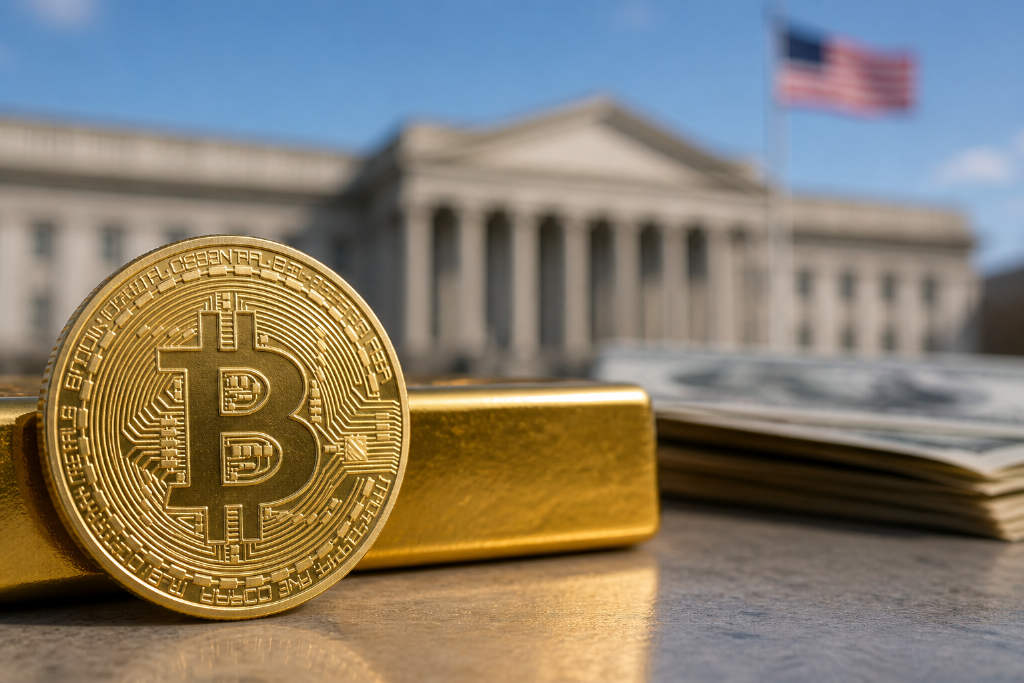
Bitcoin2026-09-07 11:45:34Bitcoin Shows Greater Immunity to Bond Market Volatility Than Gold, Hard Asset Appeal GrowsAs fiscal concerns over developed economies rise, both gold and bitcoin have strengthened. The 90-day correlation between BTC and gold reached 0.59, the highest since 2020. However, bitcoin's correlation with the 10-year Treasury yield is only -0.17, compared to gold's -0.41, indicating bitcoin is less tied to bond market dynamics, potentially strengthening its case as a hard asset.760
Bitcoin2026-09-05 01:33:12Bitcoin Reappears as 'Amplified Gold' as Four-Year Cycle Theory Warns of Downside RiskBitcoin's recent price action has shown heightened correlation with gold, with Bitwise's research head calling it 'amplified gold.' But the four-year cycle theory suggests a potential bear market bottom around November 2026 if historical patterns hold, while Galaxy's research head expects a correction floor between $40,000 and $46,000. Fidelity's VP counters that the cycle is not a precise timing rule.1120
Bitcoin2026-09-04 16:56:49Bitcoin-Gold Correlation Hits Six-Year High as Investors Seek Safe HavensBitcoin's correlation with gold has climbed to a six-year high, driven by investors seeking stability amid economic and monetary concerns, according to Crypto Briefing. The trend highlights a shift in preference toward hard assets.730
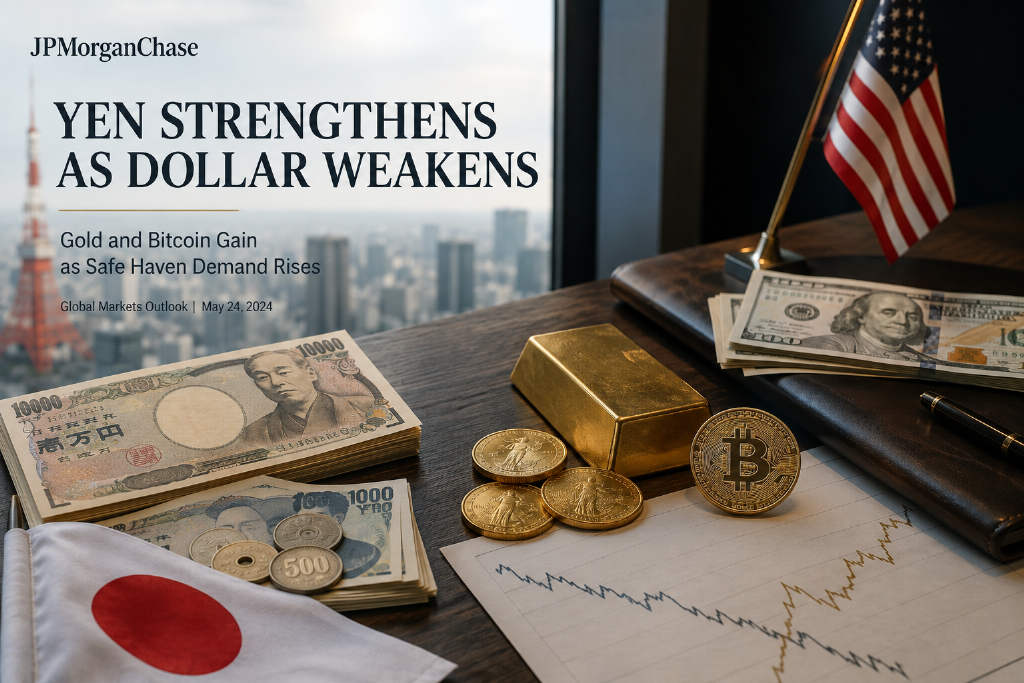
Yen2026-09-03 11:19:56Yen Surge Weakens Dollar Index, Boosts Bitcoin and Gold TemporarilyYen's rise leads to broad-based USD weakness, driving the Dollar Index lower. Bitcoin and gold are benefiting from this trend, at least for now.800
gold2026-08-13 08:22:06Gold Falls 26% From $5,300 Peak as 0xKyle Says Central Banks Have Started Buying AgainBlockTempo, citing trader 0xKyle, published a detailed note arguing that gold may have put in a base after a 26% drop from its $5,300 high. The core claim is that central banks resumed buying after a quiet first quarter, while price action has turned constructive at the same time. In the write-up, 0xKyle says gold has reclaimed its 50-day moving average and moved back above its 200-day EMA, while also breaking a simple downtrend line. He also points to higher-timeframe RSI readings that have hovered near oversold levels seen before earlier upswings. The article frames the setup as an asymmetric trade, with investor attention now concentrated on semiconductor and momentum stocks rather than gold. It also ties the longer-term bullish case to reserve diversification after the freezing of Russian reserves and to concerns around U.S. debt. At the same time, the author does not dismiss near-term downside. He says his 20/3 Bollinger Band model has flashed a sell signal, leaving room for a pullback before any larger move higher. The note highlights $4,341 to $4,191 as a buy-on-dip zone and places trade invalidation near $4,170 on a closing basis.1570
Gold2026-08-13 08:03:25Gold rebounds after a 26% drawdown as central bank buying returns, article arguesA TechFlowPost article translated from author 0xKyle argues that gold has set up an asymmetric opportunity after a months-long pullback and renewed upside break. The piece says the metal peaked at $5,300 in February 2026 and then fell 26%, with traders spending months trying to identify a bottom. In the author’s view, the more important shift is that central banks have moved back into net buying after a quiet first quarter, while speculative excess has largely been flushed out. The article ties the correction to several factors, including Chinese liquidity conditions, the Iran war and a pause in central bank purchases. It also points to a March 2 peak in a chart tracking the year-over-year change in the People’s Bank of China’s net liquidity injections into China’s money market, smoothed by a 50-day moving average. Although daily reverse repos have recently picked up, the author says the clearer signal is that official-sector buying has resumed. On the technical side, the piece says gold has reclaimed its 50-day moving average, broken a descending trendline, moved back above the 200-day EMA and seen the 10-day EMA cross above the 21-day EMA. At the same time, the author warns that a (20/3) Bollinger Band setup has flashed a sell signal, suggesting a short-term pullback could come first. The zone between $4,341 and $4,191 is presented as an area to watch, with roughly $4,170 marked as the trade invalidation level.1330
UBS2026-08-07 15:06:19UBS says gold rally has fundamental support, sees $5,000 an ounce in H1 2027UBS said the current rally in gold is backed by underlying fundamentals and projected that prices could approach $5,000 per ounce in the first half of 2027. The view was attributed to Chief Investment Officer Ulrike Hoffmann-Burchardi and her team, according to a BlockBeats report published on Aug. 7. UBS noted that gold came under pressure and pulled back after the United States and Israel launched a war against Iran at the end of February. In the near term, the bank said risks remain. Gold could face pressure if oil prices rise, if markets price in a more hawkish Federal Reserve stance, or if bonds become more attractive. Even so, UBS kept a constructive medium- to long-term view on bullion. Hoffmann-Burchardi said the team expects inflation to ease gradually, the Fed to keep rates unchanged this year, and to restart a rate-cutting cycle in 2027. In UBS’s view, growing expectations for lower policy rates would likely push down real yields and weigh on the U.S. dollar, which in turn would support investment demand for gold and create a more favorable backdrop for the metal.1830
Strait of Hor2026-08-06 05:11:13Iran Says Strait of Hormuz Transit Agreement Near Finalization, No Direct US TalksOn August 6, Iran's Deputy Foreign Minister Gharibabadi said an agreement between Iran and Oman on the passage of commercial vessels through the Strait of Hormuz is near finalization. The two sides are planning to establish a new transit model different from that of the past 60 years. Gharibabadi also noted that Iran and the US are not currently in direct negotiations, although Tehran has received messages from Washington indicating the US is prepared to resume honoring commitments under a previously signed memorandum of understanding. Markets continue to watch how the situation around the Strait of Hormuz evolves, particularly its potential impact on crude oil, gold, and safe-haven assets.1920